Do you want to hear the story of gold? I will tell the technical story in this video
Context mode is active. Hover over any highlighted term to see its definition. Click a nested term to go deeper.
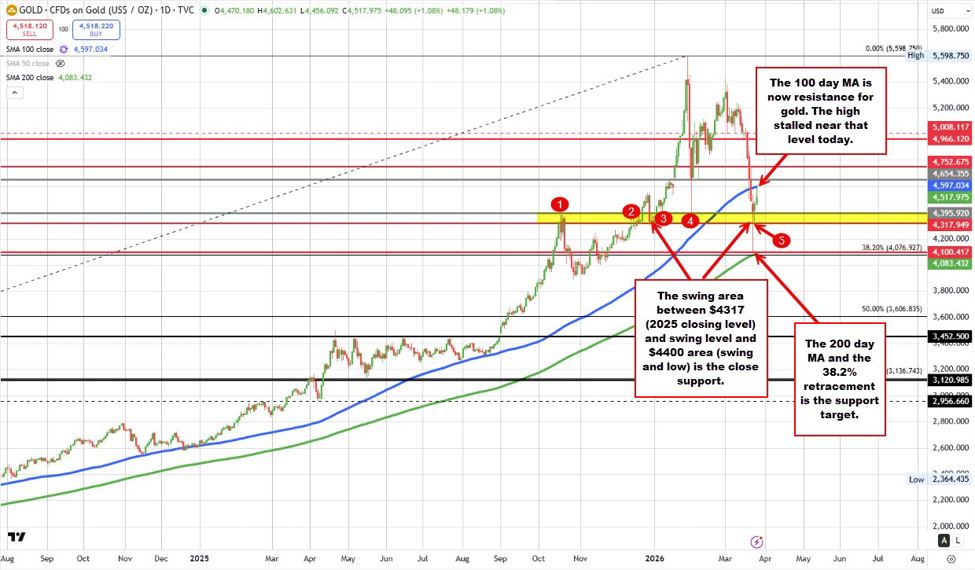
Gold experienced significant volatility in early 2026, peaking at $5,598.75 in late January after closing 2025 at $4,317.95, before a sharp reversal to $4,400 by early February. Despite a rebound to $5,400 by March 1, coinciding with a hypothetical Iran–US/Israel war, the price then rotated lower, eventually finding strong support around $4,076–$4,083 at a key confluence of the 200-day moving average and 38.2% retracement. Following a 12.5% rebound to $4,602, resistance was met near the 100-day moving average, with gold currently trading around $4,537, establishing clear technical borderlines for future movement. This price action illustrates the crucial interplay between market psychology, technical indicators, and perceived geopolitical risks in a volatile commodity like gold. The failure of gold to extend higher even in the face of a hypothetical major geopolitical conflict (the Iran–US/Israel war described in the article) suggests that while risk aversion generally drives gold up, strong underlying selling pressure or profit-taking can override initial reactions, particularly when key technical resistance levels are encountered. Furthermore, the market's current consolidation between identified support and resistance levels highlights a battle between buyers and sellers, where the ability to hold above or break below critical moving averages will dictate whether gold continues its recent rally or faces further downside pressure, independent of geopolitical events.